
Posts Tagged ‘Barnett Shale Pollution’
Highlights from Monday: How the State Hides Gas Industry Pollution
 Want to see one example of how low state bureaucrats will stoop to underplay the significance of the impact of oil and gas pollution on DFW air quality? Take a look at some slides that were part of Monday's presentation by Downwinders at Risk's Jim Schermbeck to the regional air planning meeting.
In the first you'll see how the state officially ranks all the "source categories" for human-made, or "Antrhopogenic," smog-forming Nitrogen Oxides (NOx) and Volatile Organic Compounds (VOCs) pollution in North Texas (all the numbers are Tons Per Day):
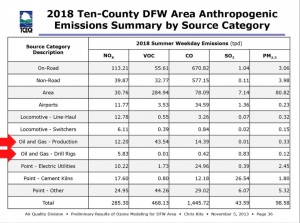
Yes the pic is fuzzy, (we can land a person on the Moon but can't seem to get charts to show up with a jpeg format online) but if you squint really hard, you'll notice there are two categories for Oil and Gas pollution numbers among the more traditional "Point Sources," Off-Road, "On-Road", etc – "Oil and Gas Production" and "Oil and Gas – Drill Rigs." Looking at these two categories you might think that adding them together would produce total Oil and Gas pollution numbers. You'd be wrong.
As it turns out, there are other Oil and Gas pollution numbers hidden away in other categories in this chart not labeled "Oil and Gas." For example, in both the "Area" and "Point-Other" categories are the numbers for NOx and VOCs pollution from gas compressors. But wait, you object, aren't gas compressors an integral part of any kind of "Oil and Gas Production?" Yes, yes they are. So why aren't they included in that category instead of being stuffed anonymously in these other categories? Great question. Perhaps it has something to do with the volume of pollution they release. Because when you finally wrestle the numbers from the Texas Commission on Environmental Quality (the TCEQ didn't voluntarily offer this information), compressor pollution turns out to double the amount of smog-forming NOx released from the Oil and Gas industry in the DFW 10-county "non-attainment area." And NOx pollution is what the TCEQ keeps saying is driving our chronic smog problem. Here's the way Schermbeck presented the same TCEQ "source categories" with the compressor numbers now teased out and added to the ones already identified as Oil and Gas:
These additions raise the industry's polluter profile significantly. And that's what this next slide is doing. It's totaling all the Oil and Gas pollution and then re-ranking the categories based on these new numbers. Same totals, just different, and more honest, organization of the individual source figures. Instead of Oil and Gas emissions looking relatively small in relation to other sources like cement kilns and power plants and even locomotives, it escalates the Oil and Gas industry into one of the region's foremost industrial air polluters:
And even this much larger number is still underplaying the total amount of air pollution fracking adds to regional air quality because the state hasn't bothered to try to tease-out the "on-road" pollution that all those fracking waste and water trucks adds to the mix. State air modelers shrugged their shoulders and said they couldn't figure out how on earth to do that. Just by "Googling" the subject, Schermbeck found at least two previous studies that did that very thing – a 2005 Denton report and a 2013 Rand Corporation report that even estimated the amount of dust pollution raised by those trucks.
While those truck totals remain a mystery for now, using the TCEQ's own numbers, compressors make up at least 53% of the total NOx pollution released by the Oil and Gas industry in North Texas, and a full quarter of all VOC pollution released. According to Schermbeck, that's why they make such good targets for electrification, an air pollution control measure he was recommending as part of his larger presentation to the regional air planning committee on Monday.
This is just one example of the kind of duplicitous behavior the state of Texas is resorting to in trying to hide the true environmental and public health impact of the Oil and Gas industry. No slight of hand is too petty. Only by diligent digging by citizens is the truth coming out, ton by ton.
Schembeck's entire (unfuzzy) presentation is now online at the North Central Texas Council of Governments website as part of the June 16th agenda. It loses something without his accompanying narration but the jest of it is easily discerned for those who want to plod through it: TCEQ is doing anything but a sincere job of building a serious clean air plan for DFW. But then again, we bet you already knew that.
Thank You. Citizens Might Have Just Saved The Local Air Planning Process…From Itself
 A year from now, last Thursday' meeting in Arlington may be seen as a turning point.
Local residents refused to let the air quality planning process die, showing up in numbers that forced officials to switch to a larger room, and making sure their opposition to another state "do-nothing" air plan was heard loud and clear.
Their participation had already changed the day's agenda. Included was a breakthrough UNT study that directly challenges the Texas Commission on Environmental Quality's claim that natural gas emissions don't increase DFW smog.
UNT's Dr. Kuruvilla John's presentation of the new study received quite a bit of media coverage, before, during, and after Thursday's meeting. You can find some of the best coverage by clicking on the links below.
UT-Austin Study Reveals "Underestimates"
Dr. John's presentation influenced another researcher's slide show as well. Scheduled to speak about older, more generic ambient air measurements for ozone, Dr. David Allen of UT Austin instead presented more recent research into gas pollution as well.
Overlooked in the debut of the UNT study, Allen's constant monitoring of one drill site in Fort Worth revealed that the TCEQ was underestimating emissions from the pneumatic valves at the site by 159%.
That was news to both citizens and TCEQ, who said they hadn't looked at Allen's research and hadn't corrected their inventories to account for such underestimates. Valves like these are powered by natural gas, are quite numerous on gas equipment, and account for a large percentage of VOCs released from a fracking site.
A Better Picture of Oil and Gas Pollution
Citizen cross-examination of TCEQ staff members present at the meeting also revealed a different look at the volume of Oil and Gas industry pollution in the 10-county DFW "non-attainment area"
Up to Thursday, TCEQ was dispersing Oil and Gas pollution across several categories, making it impossible to show the true total impacts.
Here's an example of the way TCEQ likes to present the info:
SOURCES OF SMOG-FORMING NITROGEN OXIDE POLLUTION (NOx)
IN DFW's NON-ATTAINMENT AREA
1. "On Road" vehicles 113.21 tons per day
2. "Non-Road" vehicles" 39.87 tpd
3. "Area" 30.76 tpd
4. "Other Point Sources" 24.95 tpd
5. "Locomotives" 18.90 tpd
6. "Cement Kilns" 17.60 tpd
7. "Electric Utilities" 15.02 tpd
8. Oil and Gas Production 12.21 tpd
9."Airports" 11.77 tpd
10. Oil and Gas Drill Rigs 5.83 tpd
TOTAL 290.12 tpd
This makes it look like Oil and Gas pollution is not that big a deal.
But it turns out TCEQ is hiding 28.44 tpd of NOx gas compressor pollution in the "Area" and "Other Point Source" categories.
This was brought out in questioning on Thursday. Once you add these figures to the other Oil and Gas emission numbers spread out over different categories, this is what you get:
SOURCES OF SMOG-FORMING NITROGEN OXIDE POLLUTION (NOx)
IN DFW's NON-ATTAINMENT AREA
1. "On Road" vehicles 113.21 tpd
2. Oil and Gas Industry 46.48 tpd
3. "Non-Road" vehicles 39.87 tpd
4. "Locomotives" 18.90 tpd
5. "Cement Kilns" 17.60 tpd
6. "Area" 15.93 tpd
7. "Electric Utilities" 15.02 tpd
8. "Other Point Sources" 11.34 tpd
9. "Airports" 11.77 tpd
TOTAL 290.12
(Earlier today we put out an e-mail alert that left 10 tons off the "Area" category in this second chart, greatly affecting its ranking. That mistake is corrected in this version of the chart and we apologize for any confusion that might have caused)
When you quit playing the state's shell game with Shale pollution, the Oil and Gas industry becomes the region's second largest source of NOx pollution – the kind of pollution TCEQ says is the main driver of smog in DFW (not even counting all the pollution from O&G fracking trucks still hiding in the "On Road" category).
There have been control measures for cars to reduce NOx. There have been controls on heavy duty equipment and trucks to reduce NOx. There have been new controls on locomotives to reduce NOx pollution. There have been controls on airport ground equipment to reduce NOx pollution. There's even been middling controls to reduce the NOx from the Midlothian cement kilns. But where's the controls to reduce NOx from the Oil and Gas industry – the one source in this list that hasn't had the same kind of regulatory attention? Good question – save it for next time.
Citizen Participation is Crucial
This is the kind of close examination the TCEQ hopes to avoid by limiting debate on this new clean air plan, scheduled to be submitted to EPA by July next year. And it's exactly why citizens need to keep showing up.
Because of the momentum and interest coming out of Thursday's meeting, citizens also got the next scheduled pow-wow of the local air planning process moved up to late May or early June instead of waiting until July.
We're already taking suggestions for what you want to see on that agenda, so don't be shy. And thank you again for restoring some tiny amounts of integrity into a process that's been swamped by Rick Perry's indifference.
You're making a difference, and that's all anybody can do. This last Thursday it was a big difference. Let's try to do the same in May.
Some Coverage of Thursday's Air Planning Mtg.
Channel 8: "UNT researchers say fracking a contributor to North Texas smog problem"
Texas Observer: "Studies: Links Between Fracking and Smog Pollution Stronger Than State Claims"
Star-Telegram: "Natural Gas Production Contributing to Higher Ozone Levels, study Finds"
Denton Record Chronicle: "Officials: No New Plans to Clean Up Air"
HOW YOU CAN SAY "THANK YOU" BACK
Here's what Downwinders at Risk did this past week to make sure Thursday's air quality meeting wasa success:
1) Pressed for and got the UNT study linking fracking to smog on the meeting agenda after being told it would not be included.
2) Sent out releases to the media advertising the UNT presentation.
3) Sent out alerts to you and others to let you know about the new UNT study and the meeting itself.
4) Sent out a "Citizens' Guide to the Meeting" so you could be prepared for Thursday.
5) Showed-up at Thursday's meeting with handouts showing the lack of air quality progress in DFW and the lack of a complete plan by TCEQ
6) Used our questions to reveal how TCEQ was hiding Oil and Gas industry pollution totals in their data
7) Pressed for and got an earlier "next meeting" of the local air quality planning group
8) Sent out this follow-up so that everyone knows what went on and what the news is from the meeting
A local forum for clean air issues was about to disappear.
Only the last month's mobilization of citizens prevented that from happening on Thursday.
Who began that mobilization?
We did.
We really need your financial help to keep doing this. We don't get state or national funding – just local money from people like yourself.
Thanks. We very much appreciate it.