
End of Year Report: DFW Smog Goes Up While Going Down; PM is Worst Since ’03
Only in the nonsensical world of EPA air quality regulation could the official regional average for DFW smog actually decrease despite the worst levels of DFW Ozone pollution in five years.
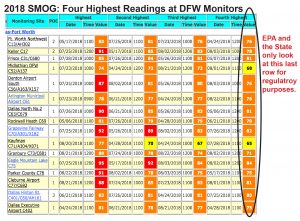
In 2018 a quarter of all North Texas official monitor sites recorded smog levels in the 90-95 ppb range for more than an hour. 2018 was the first time in two years that any DFW monitors have had 8-hour averages of 80 ppb or above, and the first time since 2013 since there been at least six. In fact, this year’s total number of 80-or-above monitors is almost equal to the total number from the last five years combined.
Nevertheless, the regional average for smog pollution that determines government action actually went down from 81 to 76 parts per billion.
How does that happen? Not without a lot of numerical manipulation. EPA’s formula for smog pollution classification is a two part affair. First EPA only counts the highest 4th highest annual reading from each monitor in DFW. That means every monitor gets three “Mulligans” or “do-overs” before the results are eligible for regulatory use. Then EPA combines the last three year’s worth of those highest 4th highest readings to produce a rolling average. So that 2018 average is actually the results of the highest 4th highest reading from 2016, 2017, and 2018.
High readings from the summer of 2015 are rolling out of that three-year rolling average, while lower readings in ’16 and ’17 remain. While this year’s smog levels were higher, but not so extraordinarily high as to be able to counter the lower numbers making up the rest of the average.
But our smog was bad enough last year and this to once again make sure DFW is in “non-attainment” of the clean Air Act for the pollutant. For the umpteenth time in a row, we missed a deadline for meeting a Clean Air Act smog standard – this time it’s the 2008 75 ppb standard. If EPA follows its own protocol, that means DFW will be go from being “moderately” out of compliance to being in “Serious” non-compliance.
And please remember all of these numbers are based on only 20 smog monitors, half of which are located well-outside the DFW urban core, and none of which are located in Wise County, where Downwinders is doing the job of monitoring ozone pollution that the State and EPA refuse to do.
 What are the consequences of this continuing violation of the Clean Air Act that imperils public health? Nada probably. At least while the Trump Administration holds office. In the past such classifications would have triggered a process leading up to some kind of official plan of action that, at least rhetorically, is aimed at correcting the 30-year old problem. But no one expects the State of Texas, or now the EPA, to take that responsibility seriously.
What you can expect is some official TCEQ spin about how it’s been successful in bringing down smog pollution levels. In fact, it was the wettest September on record that brought an abrupt end to what was shaping up to be an even worse smog year than it already was at the end of August. Historically, September is when DFW sees some of its worst bad air days. But not this year.
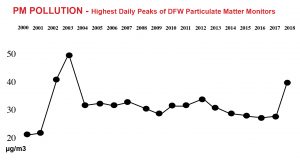
Accompanying the rise in smog pollution in 2018 was also a dramatic rise in the regional numbers for Particulate Matter (PM) pollution – the highest North Texas has seen since 2003.
After a long spell of annual peaks of between 24 and 28 migrograms per cubic meter of air, the 2018 average for highest daily readings among all sites has risen dramatically as of this month – to almost 40 µg/m3
Before this year, they’d only been four daily peaks above 40 µg/m3 over the last 15 years. In 2018 four out of 6 PM monitoring sties had registered daily readings averaging between 41 an 43 ppb as of October.
The EPA annual standard for PM pollution is 12 µg/m3. The 24 hour standard is 35 µg/m3.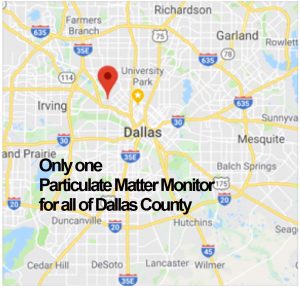
As with smog, these readings are coming from a very small pool of monitors – in this case just six PM monitors scattered over an area only slightly smaller than Rhode Island.
Some of this might be blamed on the drought we we experiencing during the summer and increased dust circulation, but comparing it to 2011 when similar if not worse conditions were in play shows no similar bump then. Fewer coal plants blowing their plumes into DFW this year might lead you to think we were even due for a drop. Instead it’s as if someone turned the key on a couple more. There’s no obvious reason why PM levels would have jumped so much in a single year.
What’s clear is that local governments are the last refuge for effective and new air pollution control measures. Until political leadership changes in Austin and/or Washington, there’s no expectation of any relief. In fact, every day sees new proposals from the State or EPA that will actually increase smog and PM pollution in DFW. This is why local city and county elections are just as important as state and national ones.
 We’ll have to wait until the end of 2019 to see if this rise in pollution averages is a trend or blip, but there’s no question that smog and PM are taking their toll on public health in DFW. Study after study shows harms at levels of exposure well below these annual and daily averages that determine EPA regulations. In the real world, your lungs, heart, brain and immune system don’t seem to be able to distinguish between “safe” and “unsafe” levels of poison as defined by the government.